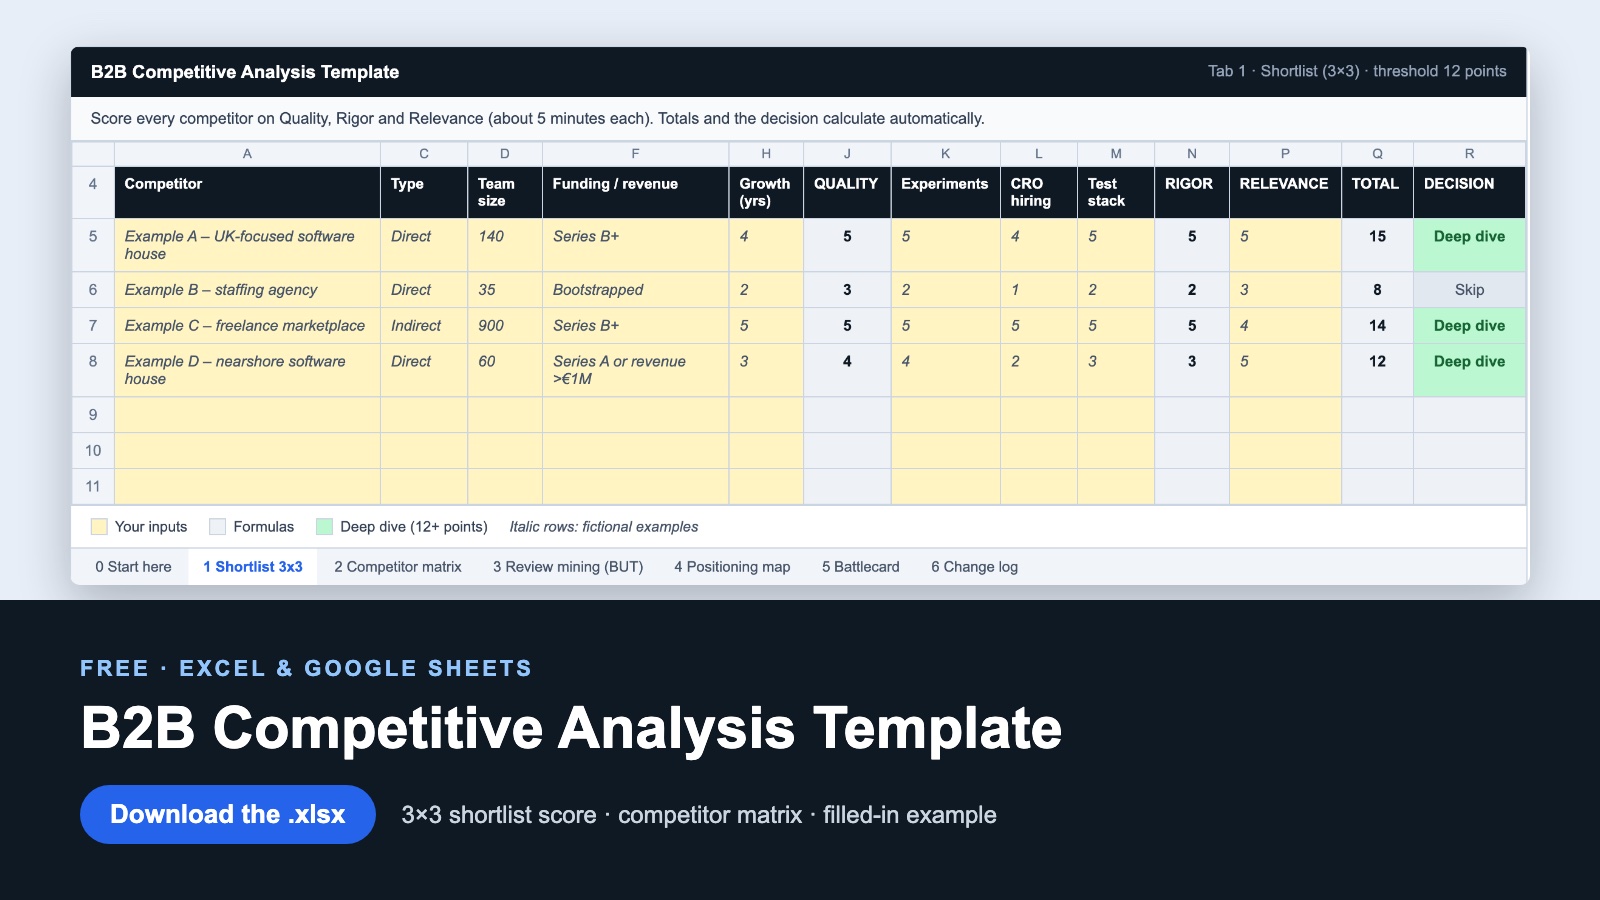
A competitive analysis template is a spreadsheet that puts you and 3–5 competitors side by side on the same fields: company overview, product and pricing, positioning and messaging, channels, proof and SWOT. This free B2B version adds the step most templates skip: a 3×3 score (Quality × Rigor × Relevance, about 5 minutes per competitor) that decides which competitors deserve a column at all.
Download the free competitive analysis template (Excel and Google Sheets)
No email needed. Download the .xlsx for Excel, Numbers or LibreOffice, or make your own copy in Google Sheets. The formulas work in both.
- Start here: the steps, time budget and scoring rubric
- Shortlist 3×3: up to 25 competitors, scored and sorted into Deep dive or Skip automatically
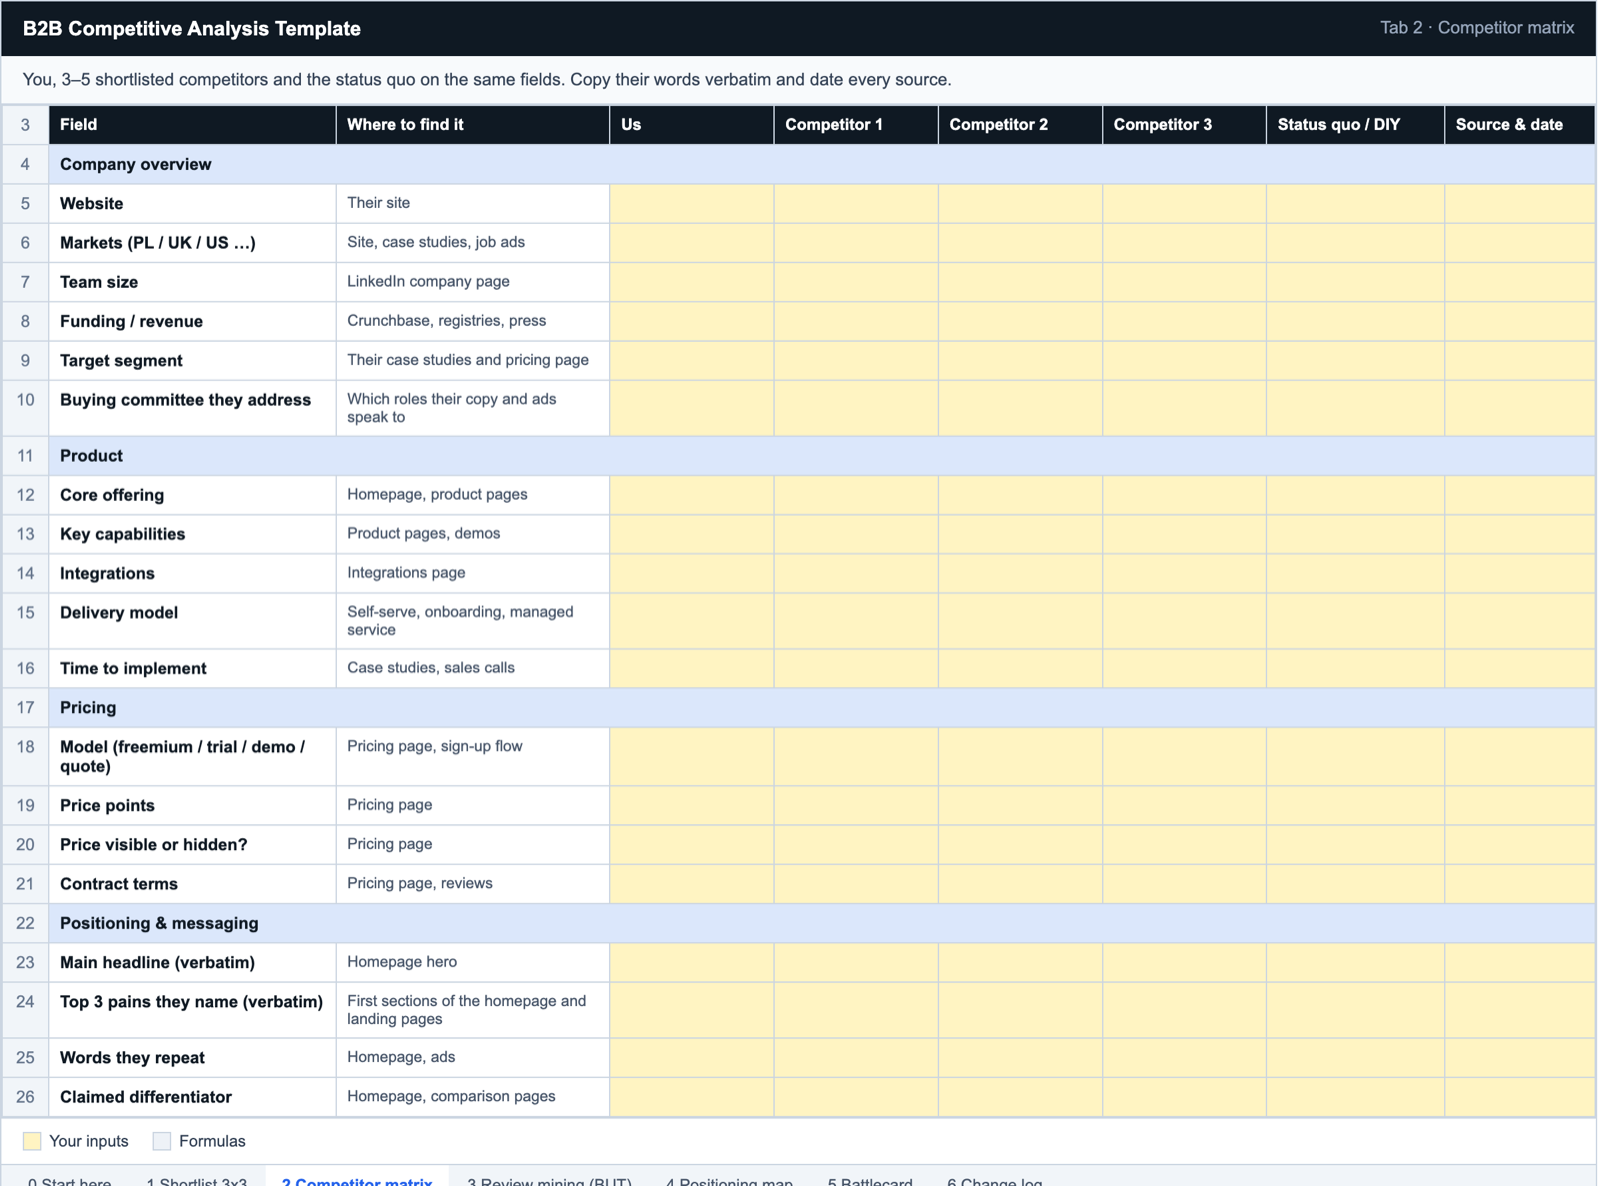
- Competitor matrix: you, five competitors and the status quo across 35 fields in 8 blocks
On this page: What to include · Step 1: shortlist · Step 2: matrix · Step 3: reviews · Step 4: positioning map · Step 5: battlecard · Filled-in example · Other templates · Updates · FAQ
I built the first version of this sheet after a project where I ended up with 23 competitors, 14 tabs and not one insight I could use in a campaign. The reasoning behind the scoring is in my competitive analysis framework. This is the working tool: it makes you choose who to analyze before you collect anything, and it keeps every claim next to its source.
What to include in a competitive analysis template
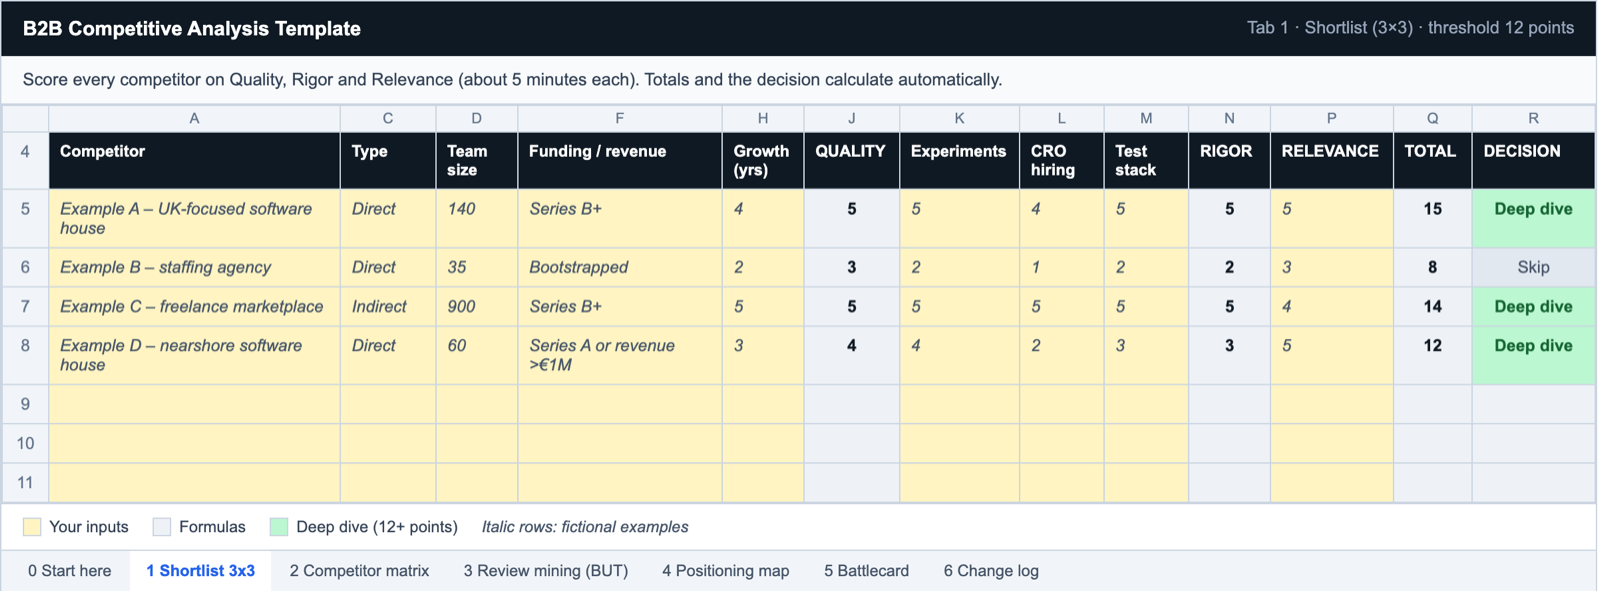
Most templates cover company overview, product, pricing, marketing and a SWOT. In B2B that isn’t enough: a committee decides, and deals are often lost to “we’ll do it ourselves” rather than to another vendor. So the matrix tab has eight blocks:
| Block | Fields | Where to get the data | Time per competitor |
|---|---|---|---|
| Company overview | Website, markets, team size, funding or revenue, target segment, the buying committee they address | LinkedIn, Crunchbase, registries | 15 min |
| Product | Core offering, key capabilities, integrations, delivery model, time to implement | Product pages, demos | 30–45 min |
| Pricing | Model (freemium, trial, demo or quote), price points, visible or hidden, contract terms | Pricing page, sign-up flow, reviews | 20 min |
| Positioning and messaging | Main headline (verbatim), the top three pains they name, words they repeat, claimed differentiator | Homepage, landing pages, ads | 45 min |
| Channels | Active channels, ads running (since when), top organic pages | LinkedIn Ad Library, Meta Ad Library, Ahrefs or Semrush | 45 min |
| Proof | Case studies, logos, certifications, review ratings and counts | Their site, review platforms | 20 min |
| Signals | Hiring in the last 90 days, partnerships, launches, funding news | Careers page, LinkedIn Jobs, press, changelog | 20 min |
| SWOT vs us | Strengths, weaknesses, opportunities, threats, each compared with you | All of the above, sales calls | 30 min |
That adds up to roughly four hours per competitor, which is why the shortlist comes first.
Two columns matter more than they look. Us comes first, because a competitor’s strength only means something next to yours. Status quo / DIY comes last: spreadsheets, an in-house hire, or doing nothing. In my experience a lot of B2B deals are lost to exactly that. To fill it, use the golden customer research question: “What do you do now, when you don’t have our product?”
Step 1: Shortlist competitors with the 3×3 score
Start with 15 to 25 names: whoever sales hears about in deals, the companies next to you in G2 or Capterra categories, and the alternatives buyers mention in interviews. Score each on three dimensions, 1 to 5 points each. Anything with 12 or more out of 15 gets a deep dive; the rest waits for the next quarterly review.
Gut-feel scores start arguments, so the template splits Quality into three sub-scores with fixed cut-offs and averages them:
| Score | Team size (LinkedIn) | Funding or revenue | Years of consistent growth |
|---|---|---|---|
| 5 | 100+ | Series B or later | 4 or more |
| 4 | 50–99 | Series A, or revenue above €1M | 3 |
| 3 | 30–49 | Seed | 2 |
| 2 | 10–29 | Bootstrapped | 1 |
| 1 | Under 10 | None | 0 |
Rigor averages three 1–5 scores the same way: published experiments or case studies with numbers, growth or CRO roles they’re hiring for, and the testing and analytics stack visible in BuiltWith (Google Analytics alone scores low). Relevance is a single score:
- 5: direct competitor, same buyer and same problem
- 4: indirect competitor with a very similar buyer
- 3: indirect, with a partly overlapping buyer
- 2: aspirational, useful for tactics only
- 1: on the list by accident
The sheet adds up the dimensions and writes “Deep dive” or “Skip” next to each name. The threshold sits in one cell on the Start tab, so you can raise it in a crowded category. Treat the cut-offs as starting points: 30 people is big for a niche consultancy and tiny for a SaaS platform. At about five minutes per competitor, a list of 20 takes under two hours. Why each dimension matters is in the 3×3 Matrix guide.
Step 2: Fill the competitor matrix (you, 3–5 rivals and the status quo)
Copy the shortlisted names into the matrix tab. Three rules keep it useful six months later:
- Quote, don’t paraphrase. “Senior engineers in your timezone in two weeks” tells you far more than “focus on speed”.
- Date every source. An undated pricing note is a rumor within a quarter.
- Write down what’s missing. No pricing page or no case studies with numbers is data too.
Give the Signals block extra time. Job ads show where a company is heading before its website does: a Head of Partnerships posting often comes months before a partner program. The method is in how hiring signals reveal B2B strategy.
Step 3: Mine 3–4 star reviews with the BUT method (G2, Capterra, Clutch)
Five-star reviews are praise and one-star reviews are often anger. The useful part is in three- and four-star reviews, right after the word “but”: “Great engineers, but onboarding took three weeks longer than promised.” That’s a problem your competitor’s customers have and its marketing will never mention.
For software, start with G2 and Capterra; for agencies and software houses, Clutch. Collect 20 to 30 quotes per competitor in the kit’s review tab and tag each with a theme (slow onboarding, hidden costs, junior team); the sheet counts the themes. For the top three, write the sentence you’ll say instead and the proof behind it. The full walkthrough is in the BUT method for competitor reviews.
Step 4: Map positions and pressure-test the white space
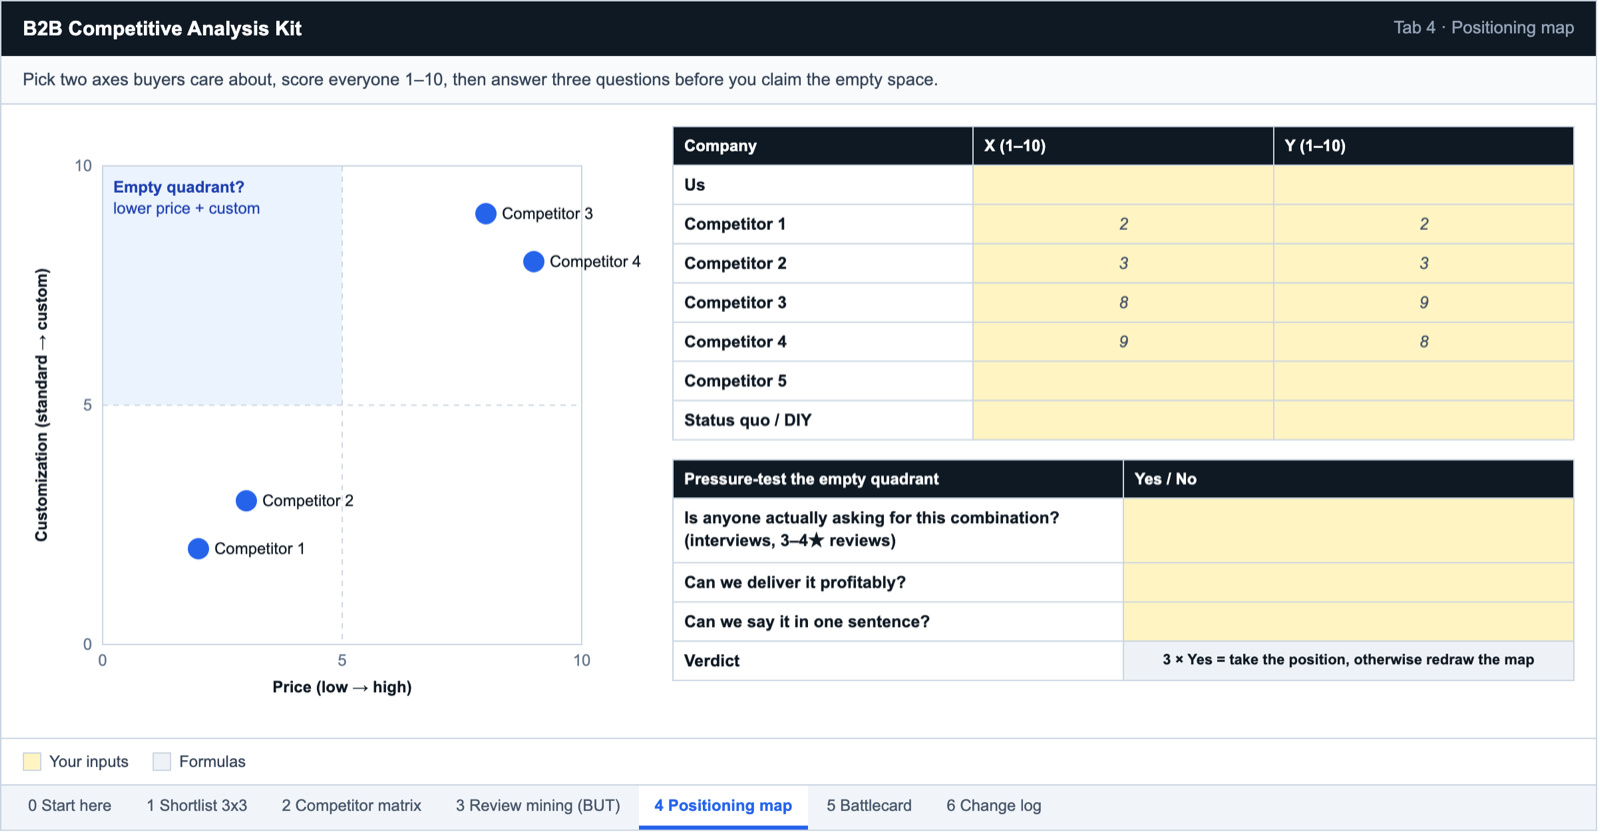
Pick two attributes buyers actually weigh, ideally ones from interviews and review themes: price, customization, implementation speed, depth of support, integration breadth, or SMB versus enterprise focus. Score everyone 1 to 10 on both and the kit draws the map.
An empty quadrant is often empty because nobody wants it. Before you claim it, answer three questions:
- Is anyone actually asking for this combination? Look for it in interviews and in 3–4 star reviews.
- Can you deliver it profitably?
- Can you say it in one sentence a buyer would repeat to their boss?
Three yeses and the sheet says “Take the position”; any no, and it tells you to redraw the map with different axes. In the example, “lower price plus custom work” is empty, which is where question 2 decides.
Step 5: Turn it into a one-page sales battlecard
The analysis pays off when sales uses it on a call. In Crayon’s 2026 State of Competitive Intelligence report, seven in ten teams said at least half of their opportunities were competitive (Crayon sells CI software, so treat it as a vendor survey). Make one page per deep-dive competitor:
- their pitch in one sentence, in their words
- where they usually win
- where they lose (from the review themes)
- landmine questions that expose their weak spot without naming them
- common objections and your answers
- proof points you can send after the call
- last updated, and by whom
Landmine questions work best when they’re about the buyer’s situation. If a competitor promises to “identify every company that visits your site”, ask how much of the buyer’s traffic comes from office networks. In our measurement on a large Polish B2B site, most visits came from home broadband and mobile networks, and an IP lookup can’t tie those to a company.
A card nobody updates is worse than none: once sales catches one outdated claim, they stop trusting all of them. Review it after every deal lost to that competitor.
Filled-in example: a B2B software house vs. 4 competitors
This example is illustrative: the companies are made up, but the scores follow the rubric and match the rows pre-filled in the template. The scenario is a software house selling development teams to UK fintech companies.
| Competitor | Type | Quality (team / funding / growth) | Rigor (experiments / roles / stack) | Relevance | Total | Decision |
|---|---|---|---|---|---|---|
| A: UK-focused software house | Direct | 5 (140 people / Series B+ / 4 years) | 5 (six case studies with numbers / growth PM / VWO and Amplitude) | 5 | 15 | Deep dive |
| B: staffing agency | Direct | 3 (35 / bootstrapped / 2 years) | 2 (generic blog / no growth roles / Google Analytics only) | 3 | 8 | Skip |
| C: freelance marketplace | Indirect | 5 (900 / Series B+ / 5 years) | 5 (publishes experiments / experimentation team / full stack) | 4 | 14 | Deep dive |
| D: nearshore software house | Direct | 4 (60 / revenue above €1M / 3 years) | 3 (two case studies / no CRO roles / HubSpot and Hotjar) | 5 | 12 | Deep dive |
Three things come out of it:
- B drops out although it’s direct. Same budget, but nothing in its playbook worth copying. It goes on a watch list.
- C stays although it sells something else. A freelance marketplace shapes what buyers expect on speed and price.
- D passes with exactly 12. Highly relevant but with little visible testing, so its deep dive focuses on offer and pricing, not marketing.
An excerpt from the matrix (wording also illustrative):
| Field | Us | A | C | D | Status quo / DIY |
|---|---|---|---|---|---|
| Main headline | “Fintech-ready teams, ISO 27001 from day one” | “Senior engineers in your timezone in two weeks” | “Hire vetted freelancers in 48 hours” | “Nearshore quality at offshore prices” | “Hire two senior developers in-house” |
| Pricing | Quote after a discovery call | Hidden, quote only | Hourly rates on the site | Day rates on request | Salaries, recruiting fees and the time it takes to hire |
| Where they lose (3–4 star reviews) | Fewer case studies outside fintech | Slow onboarding | Quality varies between freelancers | Juniors on the project | Hiring takes long; people leave |
The status quo column changes the messaging. If the real alternative is hiring in-house, the competitor to beat isn’t A but the recruiting process, and the copy moves from “better than other vendors” to “faster and safer than hiring”.
Other competitive analysis templates and when to use each
A competitor matrix answers “how do we compare with these companies?” Other templates answer other questions:
| Template | Question it answers | Use it when | In this file? |
|---|---|---|---|
| SWOT analysis | Where are we strong and weak, and what does the market offer or threaten? | Planning, or summing up one company | Yes, as the last block of the matrix (SWOT vs us) |
| Porter’s Five Forces | How attractive is this industry? (Michael Porter, Harvard Business Review, 1979) | Before entering a new market or segment | No; it covers the industry, not rivals |
| 4P / 7P marketing mix | How do product, price, place and promotion compare? | Comparing offers line by line | Partly: the product, pricing and channels blocks |
| Keyword (SEO) gap | Which search terms do competitors rank for that we don’t? | Planning content | No; note their top pages in the channels block |
| Feature comparison | Which features does each product have? | Product marketing, comparison pages | Partly: the key capabilities row |
| Positioning (perceptual) map | Where is there space nobody occupies? | Positioning and messaging | Yes, in the full kit |
Preparing a campaign rather than a strategy? The matrix is one part of a pre-launch research process.
How often to update your competitive analysis
- Every week, about an hour: Google Alerts, Visualping on pricing pages, LinkedIn Jobs and the ad libraries. Log each change with a “so what for us” note, or it becomes a news feed.
- Every quarter: rescore the shortlist. A company that scored 10 last quarter may be at 13 now.
- After an event (a launch, price change, funding round, key hire or lost deal): update the matrix and battlecard that week.
Give every competitor an owner. A sheet that belongs to everyone gets updated by no one.
FAQ
How do you write a competitor analysis? Start from the decision it should support (positioning, pricing, entering a market), then follow the five steps above. Each has its own tab in the template.
What are the 5 steps of a competitive analysis? 1) Shortlist competitors with the 3×3 score. 2) Fill the competitor matrix for you, 3–5 rivals and the status quo. 3) Mine 3–4 star reviews with the BUT method. 4) Map positions and pressure-test the white space. 5) Write a one-page battlecard per competitor and keep it updated.
What are the four P’s of competitor analysis? Product, price, place and promotion. In this template they’re rows in the product, pricing and channels blocks. The 7P version adds people, process and physical evidence, which matter more in services.
What is the difference between a SWOT analysis and a competitive analysis? A SWOT summarizes one company. A competitive analysis compares several on the same fields. Here the SWOT is the matrix’s last block, filled in after the comparison.
What is the best tool for competitor analysis? A spreadsheet plus free sources: LinkedIn, Crunchbase, BuiltWith, the LinkedIn and Meta ad libraries, G2, Capterra, Clutch and Visualping. Ahrefs or Semrush add SEO data.
Can AI be used for competitive analysis? Yes, for collecting and grouping: pulling headlines, clustering review quotes into themes, summarizing job ads. Don’t let it score competitors without evidence; that’s what the Evidence column is for.
Is there a free competitive analysis template in Excel or Word? This one is a free Excel (.xlsx) file, and you can also make your own copy in Google Sheets. There’s no Word version because the scoring needs formulas; paste the finished matrix into Word if you need a document.
How many competitors should a competitive analysis include? Score 15 to 25 on the shortlist and analyze 3 to 5 in depth. More than five deep dives usually means your threshold is too low.