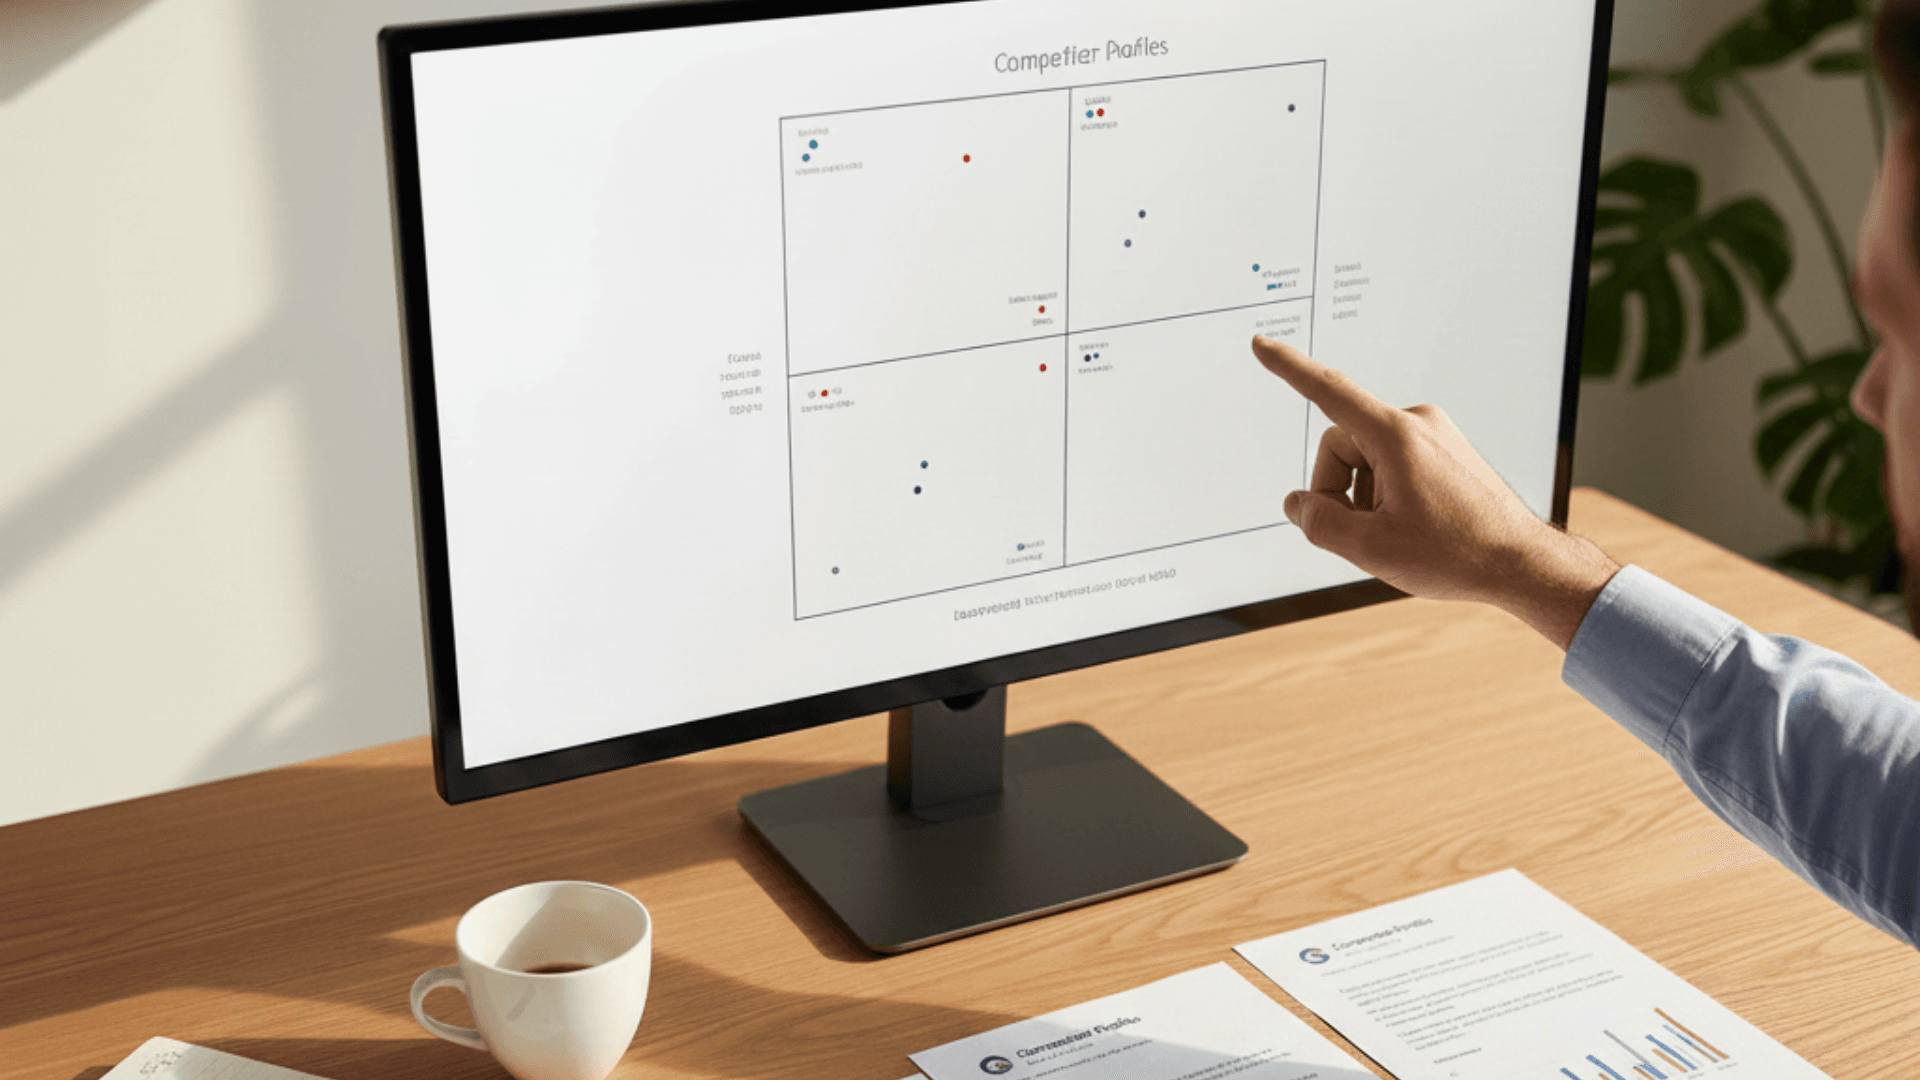
A competitive analysis framework is a repeatable method for choosing which competitors to study, scoring them against the same criteria and turning the findings into positioning decisions. The 3×3 Matrix is one such framework for B2B: you score each competitor from 1 to 5 on Quality, Rigor and Relevance and keep only the ones with 12 or more points out of 15, which usually leaves three to five companies worth a deep dive.
TL;DR
- Framework: the 3×3 Matrix scores competitors on Quality, Rigor and Relevance (1-5 each). Keep only those scoring 12+ out of 15.
- Key insight: in B2B competitor analysis, a deep look at 3-5 of the right competitors tells you more than a shallow pass over 20.
- Versus SWOT and Porter’s Five Forces: those describe your own position and your industry. The 3×3 Matrix decides whose playbook is worth studying. You can use all three together.
In this guide: What a competitive analysis framework is · Frameworks compared · The 3×3 Matrix · Competitive assessment example · 6 steps · White space · Battlecards · FAQ
I learned this the hard way. For one B2B SaaS client I built a list of 23 competitors, an Excel file with 14 tabs and eight hours of screenshots, prices and reviews, and I still could not name a single insight we could launch a campaign on. Two weeks later I was still analyzing while the budget waited. The data was fine. I was studying everyone instead of the few competitors who could teach me something.
What is a competitive analysis framework?
A competitive analysis framework gives you the same questions and the same scoring for every competitor, so the result is a decision (who to watch, where to position) and not a folder of screenshots. Most teams use one of these five:
- SWOT analysis: your strengths and weaknesses against the opportunities and threats in the market.
- Porter’s Five Forces: the structure of the whole industry, as described by Michael Porter in How Competitive Forces Shape Strategy (Harvard Business Review, 1979).
- Perceptual (positioning) map: competitors plotted on two attributes buyers care about, to find empty positions.
- Strategic group map: clusters of companies that compete in a similar way, for example on price and breadth of offer.
- Competitor scoring matrix, such as the 3×3 Matrix below: decides which competitors deserve a deep dive in the first place.
And competitors show up in most of your deals. In the 2026 State of Competitive Intelligence report by Crayon, a vendor of competitive intelligence software, seven in ten teams said at least half of their sales opportunities are competitive.
Competitive analysis frameworks compared: SWOT, Porter’s Five Forces, perceptual map, 3×3 Matrix
Each framework answers a different question. So instead of asking which one is best, ask what decision you have to make this month.
| Framework | Best for | Inputs | Effort | B2B fit |
|---|---|---|---|---|
| SWOT | A quick picture of your own position before planning | Internal data, team knowledge, market overview | Low | Fine as a starting point, but easy to fill with opinions |
| Porter’s Five Forces | Judging how attractive a market or segment is | Industry structure: suppliers, buyers, substitutes, new entrants, rivalry | Medium to high | Useful before entering a new market; says little about individual rivals |
| Perceptual map | Finding a position competitors leave empty | Two attributes buyers care about, and where each competitor sits | Low to medium | Strong, if the axes come from customer interviews rather than your own assumptions |
| Strategic group map | Seeing who really competes with whom | Pricing, target segment, breadth of offer | Medium | Helpful in crowded categories |
| 3×3 Matrix | Choosing the 3-5 competitors worth a deep dive | Team size, funding, testing signals, overlap in buyers | Low | Built for B2B lists of 15-25 rivals |
In practice I run them in this order: the 3×3 Matrix to cut the list, a deep dive on the survivors, then a perceptual map to find the gap. SWOT and Five Forces come in when the question is whether to enter a market at all, which belongs to the broader pre-campaign research process.
The 3×3 Matrix: score competitors on Quality, Rigor and Relevance
After that failed analysis I needed a filter that would tell me, before any deep work, whether a competitor was worth my time. Over the next few years of running B2B campaigns, that filter became the 3×3 Matrix.
You score each competitor on three dimensions, 1 to 5 points each, 15 points maximum. Anyone with 12 or more stays on the list. Everyone else you can set aside without guilt.
| Points | Quality: is it a serious company? | Rigor: do they test? | Relevance: same buyer? |
|---|---|---|---|
| 5 | Team of 100+, Series B or later, 4+ years of growth | Publish experiment case studies, dedicated growth team, full analytics stack | Direct competitor: same buyer, same problem |
| 4 | Team of 50-100, Series A, 3 years of growth | Mention testing in their content, 1-2 growth roles, several tools | Indirect competitor with a very similar buyer |
| 3 | Team of 30-50, seed funding, 2 years of growth | Basic tools, no visible growth roles, the site looks optimized | Indirect competitor with a partly overlapping buyer |
| 2 | Team of 10-30, bootstrapped, 1 year of growth | Only Google Analytics, no sign of testing | Aspirational: you learn tactics, not strategy |
| 1 | Team under 10, no outside validation, fresh startup | Site unchanged for years, zero testing signals | On the list by accident, different buyer |
Dimension 1: Quality (is this even a serious company?)
Many companies on a competitor list are either startups without traction, testing blindly themselves, or “zombie” companies that exist but do nothing interesting. Neither has a proven strategy you could adapt.
Check three things:
- Team size. On LinkedIn, look at the employee count and the “People” tab. A team above 30 usually means real processes, real budgets and real data.
- Funding or revenue. Check Crunchbase for funding rounds and their dates, or look for revenue figures. A Series A or revenue above a million euros a year is an outside signal that they know what they’re doing.
- Growth stability. Two or more years of steady growth suggests a repeatable system rather than one lucky quarter. SimilarWeb and their hiring pace give you a rough picture.
This takes three to four minutes per competitor.
Dimension 2: Rigor (do they actually test or just pretend?)
This is the dimension people skip most often, and I think it matters most. A company that doesn’t test is guessing, even if it happens to be doing well right now. A company with a testing culture knows what works, and that’s what you can learn from.
- Blog and content. Search their site (
site:theirdomain.com "A/B test") for “experiment”, “what we learned” or “optimization”. Teams that test write about it. Teams that don’t write about “industry trends”. - Hiring. Roles like Growth Product Manager, CRO Specialist, Data Scientist, Experimentation Lead or Performance Marketing Manager are a strong signal. Hiring signals also tell you where a company is heading next.
- Tools. BuiltWith (the free version is enough) shows what runs on their site: Optimizely, VWO or AB Tasty for testing, Amplitude, Mixpanel or Heap for analytics, Hotjar or FullStory for behavior, Segment for data. Google Analytics on its own proves little.
Dimension 3: Relevance (are they fighting for the same buyer?)
“They sell the same thing, so they’re competition” is true but incomplete. There are three types of competitors, and each tells you something different:
- Direct: same product, same buyer, same problem. If you sell email marketing software to e-commerce, Klaviyo and Omnisend are direct competitors.
- Indirect: same buyer, different way of solving the problem. This is where the gold is. If you sell project management software to marketing agencies, your direct rivals are Asana and Monday, but Notion, ClickUp and even Google Sheets fight for the same person’s attention. Their messaging shows you the buyer’s pain from another angle.
- Aspirational: companies, often from another industry, whose marketing is at the level you want to reach. Borrow their tactics and leave their product strategy alone.
Competitive assessment example: scoring a list of 23 competitors
A competitive assessment is the scoring step: you rate every rival against the same criteria before you analyze anyone in depth. Here is a real case with the names changed.
Client: a SaaS company selling a marketing automation tool to small and medium e-commerce businesses. Initial list: 23 competitors. I spent about five minutes on each.
| Competitor | Quality | Rigor | Relevance | Total | Decision |
|---|---|---|---|---|---|
| A: big player, known brand (500+ people, Series D, 5+ years of growth; monthly experiment case studies, 20-person growth team; same buyer) | 5 | 5 | 5 | 15 | Stays |
| B: startup with media buzz (12 people, seed round 8 months earlier; a generic blog, no testing tools; targets enterprise, not SMB) | 2 | 2 | 2 | 6 | Out |
| C: mid-sized and little known (45 people, bootstrapped, 3 years of growth; 3 case studies with numbers, a CRO specialist, VWO installed; same buyer, but SMS instead of email) | 3 | 4 | 4 | 11 | Out, the closest call |
C shows why the threshold matters. It tests more seriously than most of the list, but it’s too small to have the budgets and data that make its results transferable. I keep companies like that on a watch list and check them again next quarter.
At the end of the list I had:
- 3 competitors with 13-15 points: must analyze,
- 2 competitors with 12 points: worth attention,
- 18 competitors below 12 points: skip for now.
Instead of 23 companies, five. Instead of two weeks of chaotic work, two days of focused analysis.
How to run a competitive analysis in 6 steps
- Name the decision. Positioning for a new campaign, pricing, entering a market? The decision tells you which framework you need and what you can ignore.
- Build the long list. Direct, indirect and aspirational competitors. Ask sales who comes up in deals, check the categories on G2 or Capterra, and listen to customer interviews: buyers name alternatives you never considered, especially in win/loss conversations.
- Score the list with the 3×3 Matrix. Keep 12+ points, usually three to five companies.
- Deep dive on the survivors. The same four areas for each, in a separate document per competitor (table below).
- Find the white space. Plot the survivors on a perceptual map and pressure-test any empty quadrant (next section).
- Set a cadence. Decide who updates what, and how often (see the last section below).
| Area | What to check | Where to look |
|---|---|---|
| Messaging and positioning | Main headline and promise, pain points in the first three sections, how they position against others, the words they repeat | Landing pages and homepage; copy quotes word for word |
| Pricing | Freemium, trial or demo; price thresholds; what separates the plans; visible or hidden price | Pricing page, sign-up flow |
| Channels and tactics | Where they’re most active, what they publish, which ads they run, what their SEO looks like | Meta Ad Library, LinkedIn Ad Library, Ahrefs or Semrush |
| Social proof | Case studies, client logos, certifications, integrations, reviews | Their site, G2, Capterra; read the 3-4 star reviews with the BUT method |
Competitive white space: find a place where you don’t have to fight
The point of all this work is to find a gap, a place in the market where you can win without a head-on fight. The tool I use for that is the perceptual map.
Take the two variables that matter most in your industry and draw a 2×2 chart. Common pairs: price (low to high), complexity (simple to advanced), target (SMB to enterprise), service (self-service to white-glove), implementation speed (hours to months). Then place your five competitors on it and see where they cluster.
Real case: for an e-commerce client we put price on the X axis and level of customization on the Y axis. The competitors sat in two places: bottom left (low price, standard product) and top right (high price, full customization, six-week delivery). The bottom right corner was empty.
An empty quadrant isn’t automatically an opportunity. Sometimes it’s empty because the economics don’t work. Before you celebrate a gap, pressure-test it with three questions.
One: is anyone actually asking for this combination? Go back to your interview notes and to the 3-4 star reviews of the clustered competitors. If buyers keep complaining about the exact trade-off you would remove, the gap is real demand. If nobody mentions it, you’ve found an empty corner and nothing more.
Two: can you deliver it profitably? A position you can’t serve at a margin is a trap. The top-right players charge a premium partly because six-week delivery is genuinely expensive. If you promise the same customization faster and cheaper, know exactly where that money comes from.
Three: can you say it in one sentence? If your position needs a paragraph to explain, the market won’t remember it. “Custom setup in a week, not six” is a position. “Flexible solutions tailored to your needs” is not.
If all three answers are yes, that quadrant becomes your positioning statement, and every headline, landing page and sales deck should point at it. If any answer is no, redraw the map with different axes. Implementation speed, depth of support and integration breadth often show sharper gaps than price, because fewer competitors think to compete on them.
From analysis to sales: one-page battlecards
Analysis that stays in a marketing folder doesn’t win deals. For each of your three to five competitors, give sales a one-page battlecard:
- how they pitch themselves, in their own words,
- where they usually win, and where you do,
- two or three questions that move the buyer toward your strengths,
- proof (a case study, a number or a quote) that answers their strongest claim,
- the date of the last update.
Update the cards whenever win/loss interviews or sales calls show something new. A card nobody updates is worse than no card, because sales stops trusting it.
Keep your B2B competitor analysis current
B2B competitor analysis isn’t a one-time project. Competitors change strategy and new players arrive. If you do the research once and forget about it, your knowledge is out of date within a quarter.
Cadence matters. In the same Crayon report (2026), teams that share competitive intelligence weekly or faster reported revenue impact 79% of the time, against 41% for teams that share it monthly or less often. It’s a vendor survey, so read it as a direction rather than a precise effect.
- Google Alerts on competitor names plus “funding”, “launch” and “product”.
- Visualping on their key landing and pricing pages, so you see messaging and price changes.
- LinkedIn job postings every two weeks. If they hire a Head of Partnerships, a partner program is on its way.
- A quarterly review of the 3×3 scores, watch list included.
It takes about an hour a week and gives you a radar most companies don’t have.
Summary: three deep beats twenty shallow
If you have a list of 15-25 competitors and plan to “analyze them all”, stop. Score the list with the 3×3 Matrix, keep those with 12+ points, give those three to five a real deep dive, and use a perceptual map to find where you don’t have to fight. The free competitive analysis template does the scoring for you.
One of my clients applied exactly this approach. Two months later he called: “We found patterns in keyword strategy at those three companies. First campaigns gave 180% ROAS. We’ve never had this before.”
If you’d like a second pair of eyes on your competitor list, book a 15-minute call. I’ll tell you honestly whether a deeper audit makes sense.
FAQ
Which competitive analysis framework should I use? Start from the decision. To pick which competitors to study, use a scoring matrix such as the 3×3 Matrix. To find a position, use a perceptual map. To judge a whole market, use Porter’s Five Forces. SWOT works as a quick summary of your own position. In B2B the most useful sequence is usually scoring first, then a deep dive and a perceptual map.
How many competitors should you analyze? Three to five in depth. A shallow pass over 20 gives you a pile of data and no decision. Use the 3×3 Matrix to pick them: Quality, Rigor and Relevance, 1-5 points each, threshold 12 out of 15.
How often should you update a competitive analysis? Monitor continuously (alerts, page tracking, job postings) and re-score the list every quarter. Update sales battlecards whenever win/loss interviews or deals show something new.
What data do you need for a competitive analysis? Public sources go a long way: LinkedIn for team size and hiring, Crunchbase for funding, BuiltWith for tools, ad libraries for campaigns, G2 and Capterra for reviews, and the competitors’ own sites. Add what only you have: sales call notes and customer interviews.
What are the most common mistakes in competitor analysis? Analyzing everyone instead of the right few, copying competitors instead of looking for a gap, choosing perceptual map axes buyers don’t care about, and doing the analysis once and never updating it.
What is the difference between a competitive assessment and a competitive analysis? A competitive assessment scores competitors against the same criteria to decide who matters. A competitive analysis then studies the chosen few in depth: messaging, pricing, channels, proof and positioning gaps. The 3×3 Matrix is the assessment step.
What is a perceptual map in competitor analysis? A 2×2 chart that places competitors on the two variables that matter most to buyers, for example price and customization. Empty quadrants show positions you might take, but only after you check demand, margin and whether you can explain the position in one sentence.